Instrument Panel
The second sidebar tab describes how the pattern was measured.
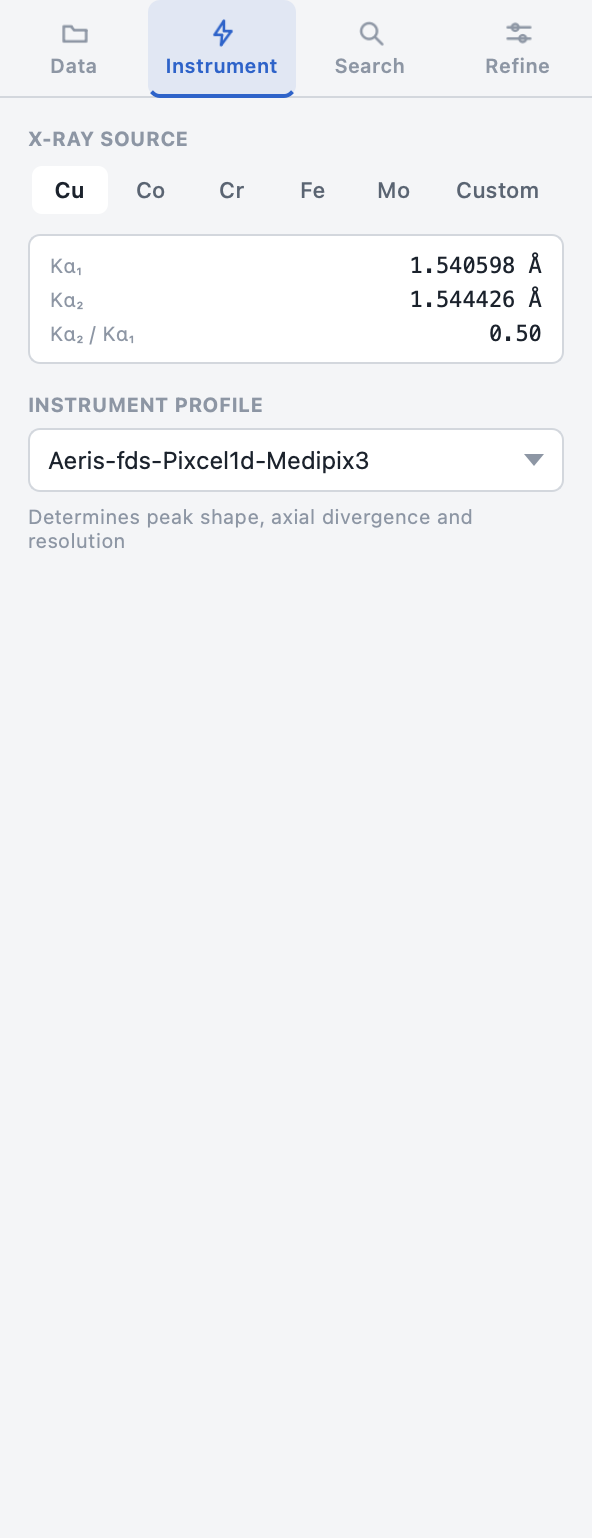
X-ray source
A segmented control with the five common laboratory anodes plus Custom:
| Source | Kα (weighted) |
|---|---|
| Cu | 1.54059 Å (default) |
| Co | 1.78901 Å |
| Cr | 2.28970 Å |
| Fe | 1.93604 Å |
| Mo | 0.70930 Å |
| Custom | Reveals a wavelength spin box: 0.1 – 10 Å, 5 decimals |
Use Custom for synchrotron data or a monochromated line — enter the exact wavelength in Å.
Kα readout card
Below the selector, a read-only card shows the doublet for the chosen anode:
- Kα₁ and Kα₂ component wavelengths,
- the Kα₂ / Kα₁ intensity ratio (0.50 for named sources).
For a custom wavelength only the single line is shown.
Instrument profile
The profile determines peak shape, axial divergence, and resolution in the refinement — pick the entry matching your diffractometer geometry.
Around 40 profiles ship with the app (from the BGMN distribution), covering
common lab instruments — Bruker D8/D2 variants, PANalytical X'Pert / Aeris /
CubiX / PW1800/PW3040, Rigaku SmartLab / Miniflex / Ultima, Siemens D5000 — plus
a generic synchrotron profile.
Default: Aeris-fds-Pixcel1d-Medipix3.
The profile matters
A mismatched instrument profile is a common cause of poor fits — peak widths and shapes will be systematically wrong, and Rwp suffers even when the phases are right. When in doubt, choose the profile closest to your optics (fixed vs. automatic divergence slit, detector type).
The status bar always displays the active source and profile, and both are saved in presets.